FoodEase
Role — Project Manager; Business Design and UX Lead
|
|
BACKGROUND:
In 2019, 409 natural disasters affected people worldwide. Similarly, after Hurricane Maria devastated Puerto Rico in late September 2017, 44% of the island remained without safe drinking water and food, while millions of water bottles and meals were left undistributed. The narrative of chaos, governmental oversights, and humanitarian shortcomings is similar around the world:
- Bureaucratic red tape stalls life-saving resources from those who need them most;
- Ineffective information-sharing hampers donation and resource management; and
- Lack of preparation and planning prevents volunteers and community members from responding efficiently to disrupted infrastructure and distribution systems.
CHALLENGE:
Connect people to critical information, food, and water in a crisis, by developing an automated, locally-driven, and scalable solution similar to the hand-drawn maps used successfully by World Central Kitchen.
Design Goals:
Project Goals:
Design Goals:
- Understand the operational blocks in top-down aid distribution
- Understand where local leverage points/actors can fill distribution gaps
Project Goals:
- Identify 2-3 local partners that could potentially roll-out a MVP
- 8-10 weekly interviews (5 survivors and 5 decision-makers or influencers)
- Usability field testing in Puerto Rico
DISCOVERY:
We initially completed an extensive literature review and landscape map to identify the current humanitarian offerings for natural disasters. I organized and led several meetings with industry experts at, i.e., research labs, think tank leaders, federal agencies, emergency and military agencies, data centers, and nonprofit organizations.
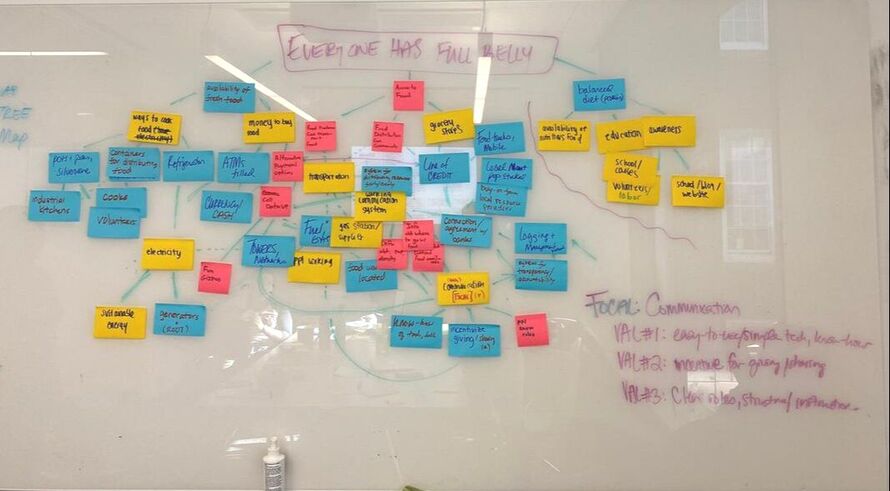
Theory of Change I: After doing a gap analysis and a utility map, I led the team through an exercise on identifying our ideals, the conditions
that allow for that, the sub-conditions, and, finally, the root needs preventing that. We identified points in the system to leverage change.
Shortly after, with a better understanding of landscape, I led over 50 individual and focus group conversations with survivors and relatives regarding disaster and relief experiences. Sessions were in-person and remote across Greater Boston, Houston, New Orleans, Puerto Rico, the US Virgin Islands, the Bahamas, Haiti, Cape Verde, China, the UK, and others.
Methods used include:
- Observing: Directed Storytelling, Card Sorting, AEIOU, Empathy Maps, Journey Maps, Personas
- Framing: Affinity and Bull's Eye Diagrams, Cognitive/Concept Mapping, Backcasting (Gap Analysis), Creative Matrix, Theory of Change, How Might We, Empathy Maps, Stakeholder Maps, Lean Canvas, Brand Ladder
- Prototyping: Storyboards, Wireframing (AdobeXD), Blockbusting (singular viewing, scoping, narrow stereotyping), Competition Analysis, Data Visualization, Supply Chain Map (Value Chain)
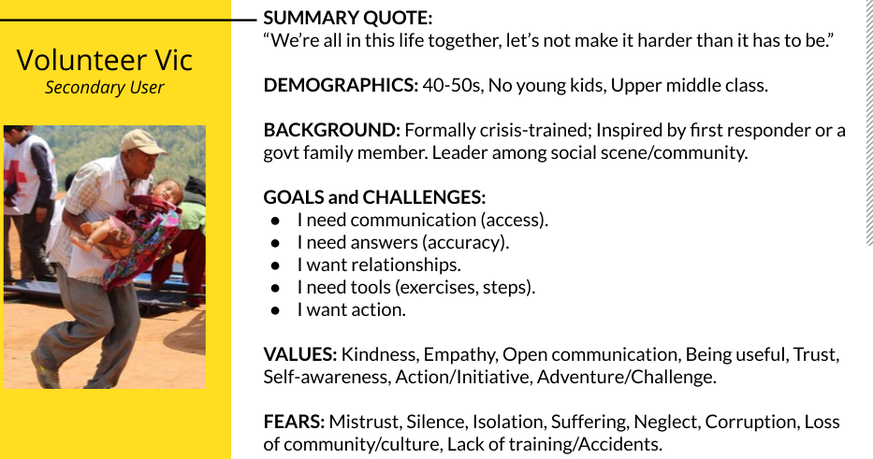
Persona II: I created profiles for each interviewee in order to combine, e.g., on-the-ground volunteers and personnel into a central persona.
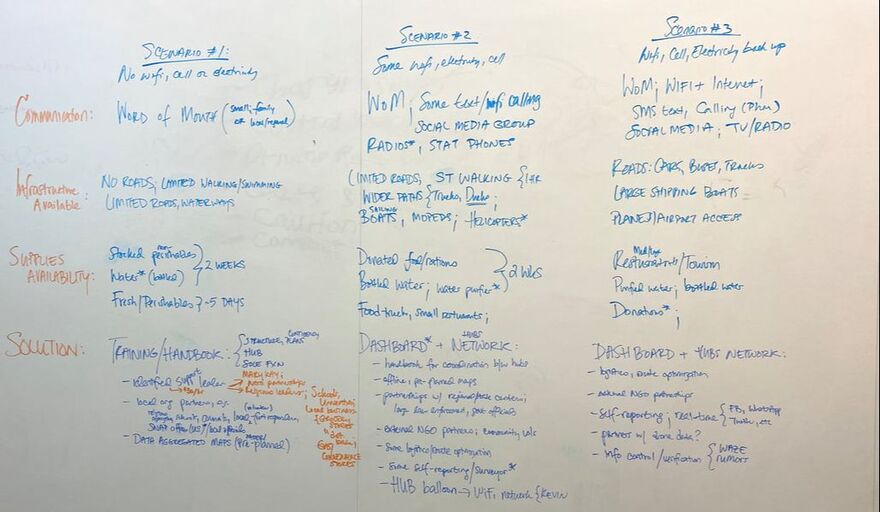
Refined Creative Matrix I: After doing a traditional journey map and AEIOU, I led the team through a scenario mapping exercise for on-the-ground personas right
after a disaster. We thought about the choices they would make for, e.g. food, help, finding information, etc and "how might we" ease each of those decisions.
As a result, we identified 3 key pain points in the disaster relief break-down, specifically for hurricanes, and formulated the following problem statement:
|
"Victims of natural disasters have difficulty receiving and sharing fresh food and clean water, because they (1) are not currently incentivized to share info; (2) do not know how to work with devices available; and (3) lack clear guidelines for effective info sharing."
|
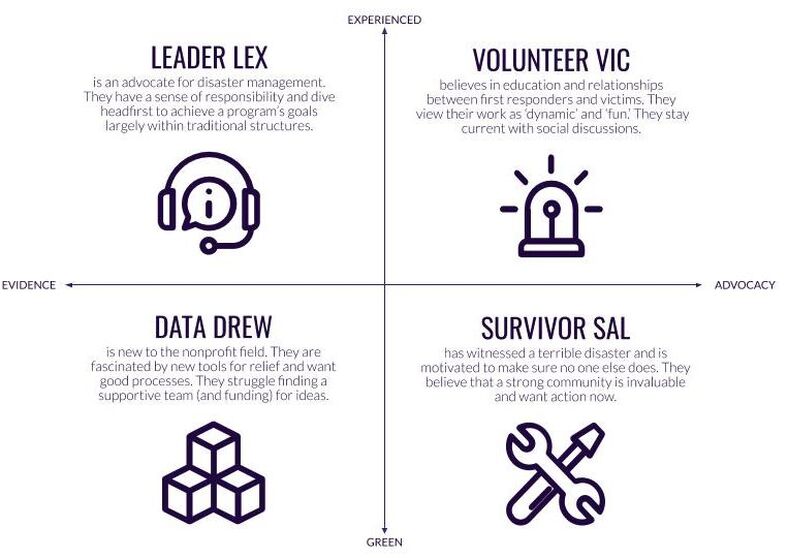
Personas: 4 core personas for those who (a) desire, (b) would use, and (c) would support a program/product for local aid distribution.
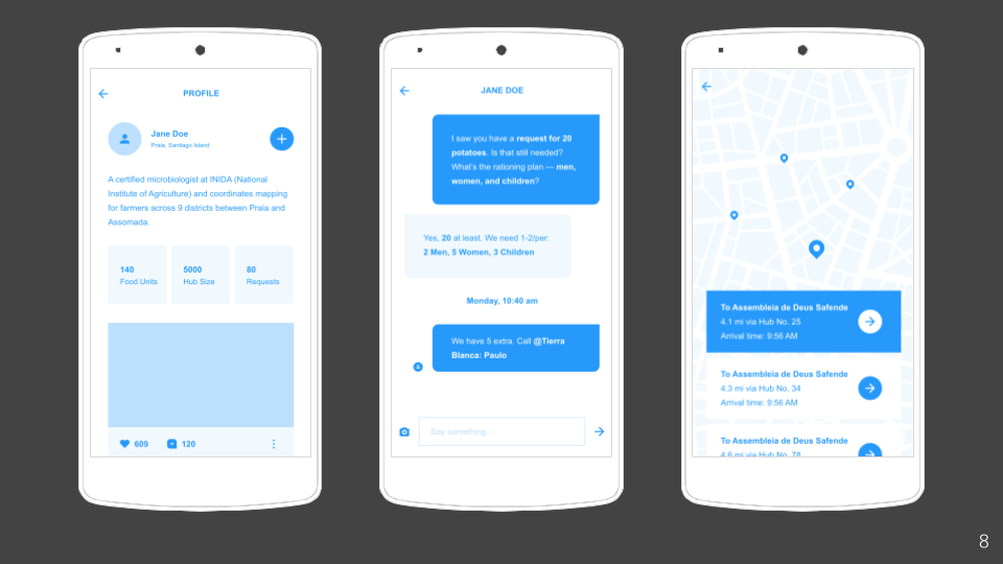
Wireframe II: I developed interactive mockups (with AdobeXD) to allow for others to review certain tasks, buttons, and layouts.
SOLUTION:
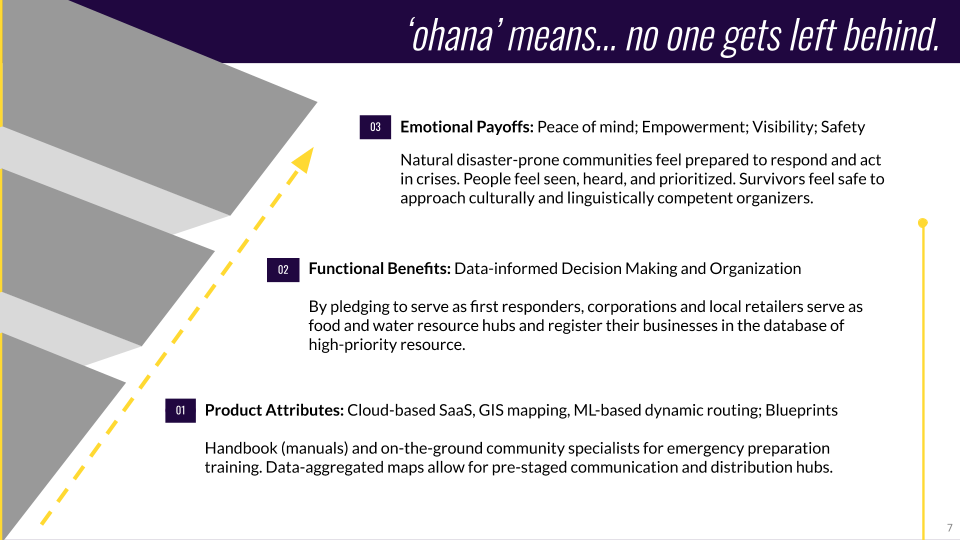
After prototyping several solutions and gathering feedback from former survivors and humanitarian leaders, we cultivated a 4-part solution concept to run through the 3 standard aid stages (planning, relief, and recovery). We wanted to consolidate inventory and reporting tasks by orienting leaders and survivors around specific actions and customer journeys.
Operating as a neutral data provider and logistics coordinator, the FoodEase platform would collect and analyze complex data at large scales, and it builds strong relationships for transparent communication and decision-making on the ground.
Operating as a neutral data provider and logistics coordinator, the FoodEase platform would collect and analyze complex data at large scales, and it builds strong relationships for transparent communication and decision-making on the ground.
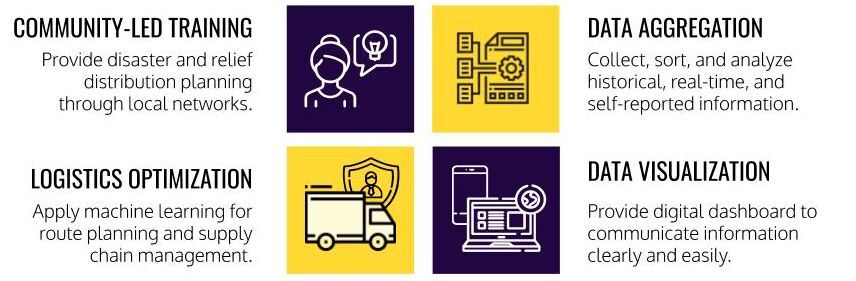
Solution Components: The core 4 offerings of FoodEase to improve humanitarian aid distribution, specifically, during hurricanes.
From an impact perspective, the solution empowers and leverages existing community networks, fulfilling the core community- and identity-centered values we heard from survivors, many of whom were from under-resourced communities.
|
|
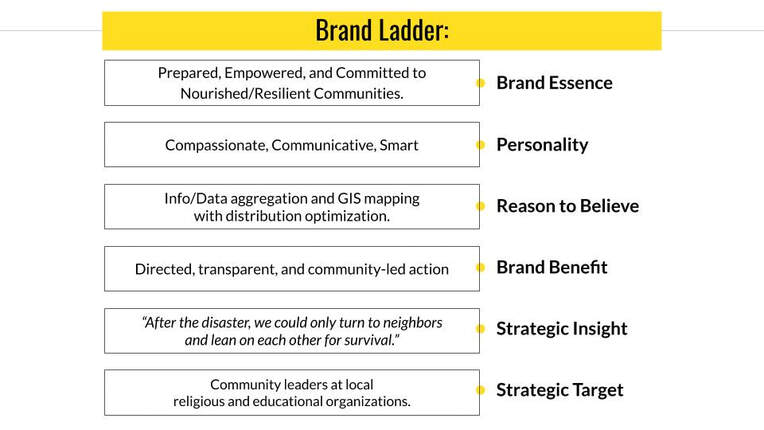
Brand Ladder II: Using the strategic insights (above), we
|
Brand Funnel II: We dived further to brainstorm how our
|
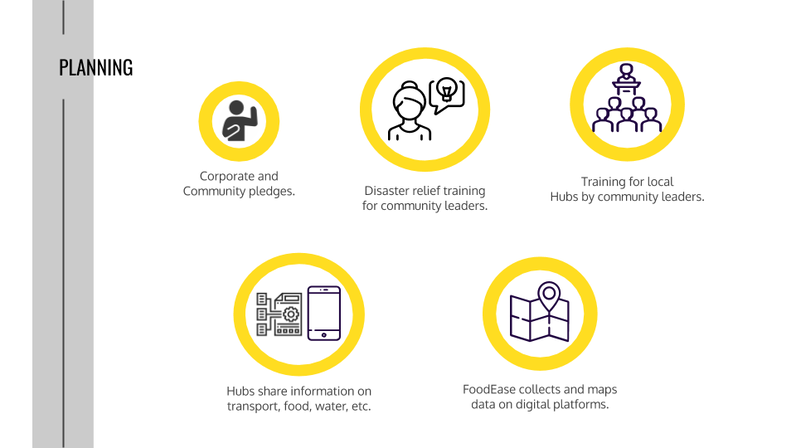
PHASE I (PLANNING):
Our research showed that disaster survivors organize and share updates through social media (e.g. Facebook, WhatsApp).
- FoodEase will, first, identify corporate and community organizations in disaster-prone areas, specifically hurricanes.
- The firm then ask those organizations to formally pledge to share their resources in the event of a crisis.
- FoodEase staff trains community leaders to develop disaster plans and facilitate training to their group, or "Hub."
Our research showed that disaster survivors organize and share updates through social media (e.g. Facebook, WhatsApp).
- Using those same digital platforms, FoodEase's integration allows “Hubs” to collect and share information on local transportation, food, and water sources.
- This data is then aggregated and visualized on a map.
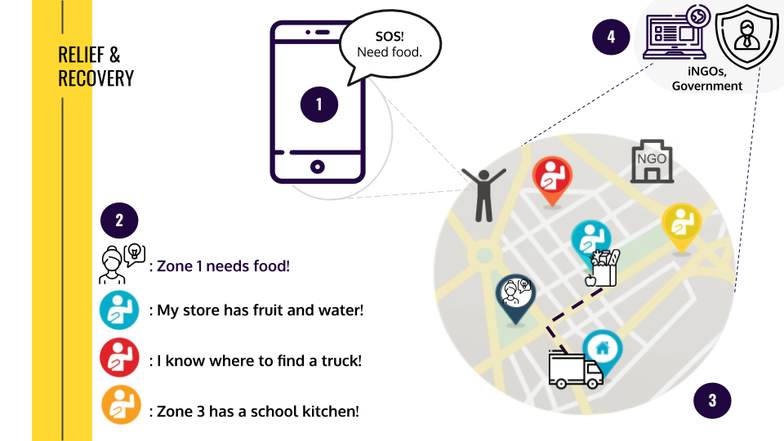
PHASE II (RELIEF):
Having done all of this data collection and mapping before a disaster, community organizations and neighborhoods can activate word of mouth much more quickly. They know where food, water, and other critical resources should be in those first few days.
Also, we found with experts that wifi is increasingly restored after that first ten days. Upon then, users can update all of this information in real-time with the Facebook plugin attached to their existing profile and online community groups.
If an individual or group is in need of food, they would make a Facebook post or tweet (as most already do now). The FoodEase platform:
PHASE III (RECOVERY):
Over time, the algorithms and database become increasingly robust through the direct user plugin and the connected dashboard presented to government and humanitarian teams. The FoodEase platform enables trend analysis and food security assessments at very granular levels.
Likewise, iGOs and NGOs can continuously access those data insights as they deploy aid programs: They can
Having done all of this data collection and mapping before a disaster, community organizations and neighborhoods can activate word of mouth much more quickly. They know where food, water, and other critical resources should be in those first few days.
Also, we found with experts that wifi is increasingly restored after that first ten days. Upon then, users can update all of this information in real-time with the Facebook plugin attached to their existing profile and online community groups.
If an individual or group is in need of food, they would make a Facebook post or tweet (as most already do now). The FoodEase platform:
- automatically collects that message and location information;
- re-directs it to the nearby leaders and Hub groups synced with the plugin;
- analyzes and presents the cloud-based information to the person in need and the Hub leader; and
- then maps where leaders, fruit and water, and possible transport are (with GIS).
PHASE III (RECOVERY):
Over time, the algorithms and database become increasingly robust through the direct user plugin and the connected dashboard presented to government and humanitarian teams. The FoodEase platform enables trend analysis and food security assessments at very granular levels.
Likewise, iGOs and NGOs can continuously access those data insights as they deploy aid programs: They can
- integrate the software management platform with their own databases to increase their effectiveness and speed; and
- can build custom reports in the program for tracking inventory (food, water, etc.) and evaluating their impact.
Refined Storyboard: A step-by-step visualization of triggers and tasks completed by the platform to relay information and resources right after a crisis.
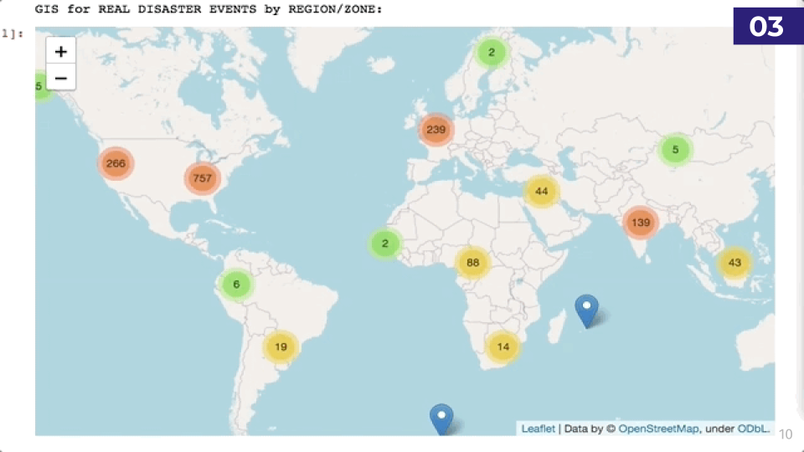
Data Visualization III: An iteration of our python program and interface design for iNGOs/iGOs. The visualization shows
predicted disaster events (using TfiDf, NLP, logistic regression), as well as clusters and risk level by region.
RESULTS:
As a result of this detailed work, FoodEase was awarded 2nd Place Winner of the 2020 Tufts 100K Venture Competition (Social Impact); accepted as a Finalist for the 2020 Tufts Food & Nutrition Entrepreneurship Competition (postponed); and accepted as a Finalist for the 2020 HBS Social Enterprise Conference (cancelled).
We had identified a target customer profile, conducted more market research, and validated a business plan for FoodEase as a nonprofit organization, creating financial projections. I also helped to develop a marketing and distribution strategy (below), building a landing website and conducting some A/B tests to monitor interest. (See our final report and the presentation below for more information.)
We had identified a target customer profile, conducted more market research, and validated a business plan for FoodEase as a nonprofit organization, creating financial projections. I also helped to develop a marketing and distribution strategy (below), building a landing website and conducting some A/B tests to monitor interest. (See our final report and the presentation below for more information.)
Overall, the project successfully reached the majority of its goals stated earlier. Unfortunately, due to COVID-19, we had to cancel our trip to Puerto Rico for field research and testing. However, we did connect with local organizations and I led the proposal design for a beta test in Somerville and Cambridge, building on the current data collection and visualization prototype. We also formulated a possible mid-term roll-out in Southeast US after a few local iterations and an extended pilot with 2-3 community groups.